Skip to content

Time Chainage Software

Time Chainage is an additional (but similar) term used for representation of linear project schedules, such as Time Location, Line of Balance, Linear Scheduling and Time Distance diagrams.

Same Principles as Other Linear Scheduling Practices

Time Chainage Software uses the same principles as other linear scheduling practices placing Time on one axis, Chainage (ie distance/location) on the other axis. Time Chainage is most commonly used across the UK and Europe and in regions which are influenced by standards and practitioners from the UK and Europe. “Chainage” is a reference to a measure of distance used in railway construction dating back to the 1800’s where one Chain equals 22yards (the same distance as a cricket pitch).

While there is little material available to pinpoint specific and exact historical usage, the term “Time Chainage” offers a clue that the technique is not a modern method, but has quite possibly existed for some time – certainly well before computer software was readily available to manage railways construction projects, and when Time Chainage diagrams and charts may have been manually drawn by hand.

tc-vs-tilos-3
time-chainage-software

Time Chainage Diagram Software

Software to produce Time Chainage diagrams has closely followed the development of project scheduling tools. During the early to mid 2000’s, construction project scheduling was dominated by a tool Called Primavera P3, and tools that could represent scheduling data from P3 into a Time Chainage diagram were already available.

Linea 3.0

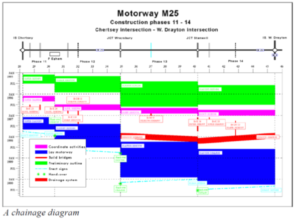
In 2002, Netronic, a German based software developer, released Linea 3.0, capable of reading Primavera P3 files. Despite reading form P3 schedules, the tool was still cumbersome and required a lot of configuration to create a meaningful output as shown below.

image2-1-300x219


Complex Tools

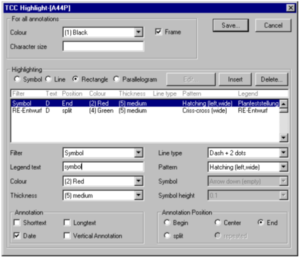
However, like much software technology of that time, the tools were quite complex, requiring expert levels of knowledge to operate effectively. The screen shown below is an example of Linea 3.0 Highlights – the method of defining the shapes and colours used to represent specific schedule tasks.

image1-2-300x258


Time Chainage Diagrams and Charts

The screen example is how the schematic representation of the linear project (shown on the top of the first image above) is created.

image3-2-293x300


Time Chainage Diagrams and Charts

Software that produces Time Chainage diagrams and charts can be assessed on two features:

  1. An analytical tool used to inspect and assess the project schedule – the Diagram
  2. A communication tool to present the project schedule – the Chart

Time Chainage and Time Location Diagrams and Charts

icon-sched-blue

Time Chainage Diagram

The Time Chainage diagram is the core output, that presents the project schedules tasks on the time vs chainage grid. Tasks may be presented as different shape types, using varying colours, styles, patterns etc to represent the different types of work elements. Using software that links to project schedules to produce the time chainage diagram minimises the chances of errors created by manually translating dates from one tool to another.

lbchart1

Time Chainage Chart

The Time Chainage chart element expands the diagram element and turns the analytical diagram into a visual communication tool. Features for Time Chainage charting include, adding title boxes, revision controls fields, logos and other images. Adding text and image annotations to the diagram may also assist in further informing readers of the contents of the diagram. Finally Time Chainage charting should enable the diagram to be filtered for the date and chainage ranges being displayed and/or the project tasks being displayed.


icon-lsched

Time Location Chart

For all intents and purposes, Time Location Diagrams and charts are the same as Time Chainage Diagrams and Charts and the terms may be used interchangeably. Turbo Chart prefers the Time Location term simply as Location - a more generic term than “Chainage”