


Chart Features: Time and Distance Grids
Such charts feature two axes, that may be rotated to be either orientation:
- Time as one axis, this may represent the entire project timeline or filtered to a specific period
- Distance or location along the project physical alignment as the other axis, this may represent the entire project alignment or filtered to a specific location range.
Chart Features: Time and Distance Diagram Shapes On Activity Grid
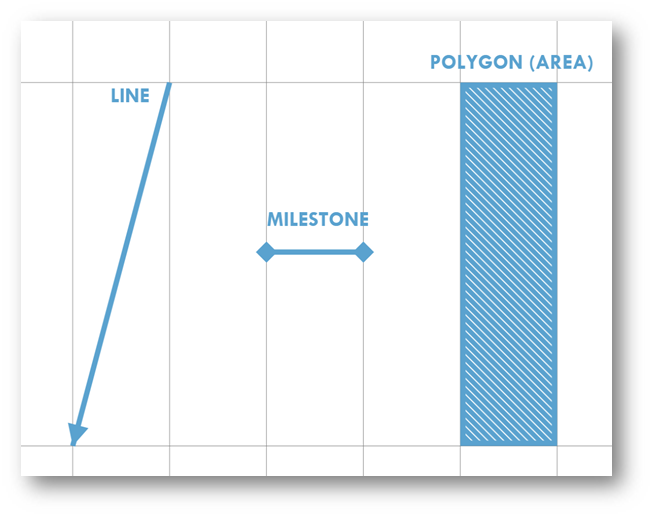
The shapes used to represent project tasks have different meanings depending on the work they represent:
- Shapes are the core element in the interpreting chart
- Shapes with a gradient, such as lines represent a rate of progress for the scheduled activity being represented. Shallow equals fast, steep equals slow e.g. track laying
- Shapes such as milestones represent events at a point in time, and can also indicate a range of locations over which this event occurs e.g. access to site
- Polygons such as rectangles can be used to represent activities that occur over a given location span for a period of time, e.g. earthworks
- Shape colour, thickness, patterns to represent the differing scope of work
Time and Distance Diagram Shapes on Activity Grid – Gradients
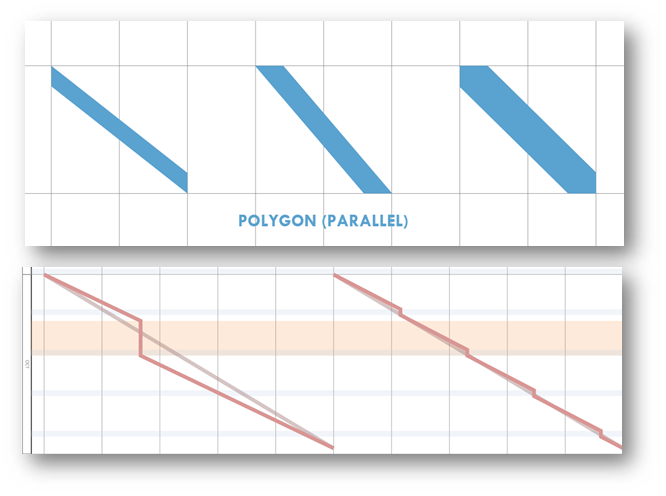
Linear tasks progressing along the linear alignment are represented by shapes with a gradient:
- Parallel bar shapes can be used to represent tasks that progress along with a project location
- Time offsets can represent the task occupying a fixed amount of time as work progresses, e.g. concrete curing
- Location offsets can represent physical space (location) occupied by the task as it progresses, e.g. Work train or limited spacing between tasks
- Shapes can also combine both offsets
- Non-Work periods represented as periods of no linear progression
Time and Distance Diagram Shapes on Activity Grid – Triangles
Triangle Shapes can be used to represent works that occupy locations over time around them:
- Triangle shapes can be used to represent tasks that progress along with a project location and that occupy time and/or locations in front or behind them, meaning other works will interfere if they are planned in the same area/time
- Consider the examples shown. Task moves from a to b in time from t1 to t2
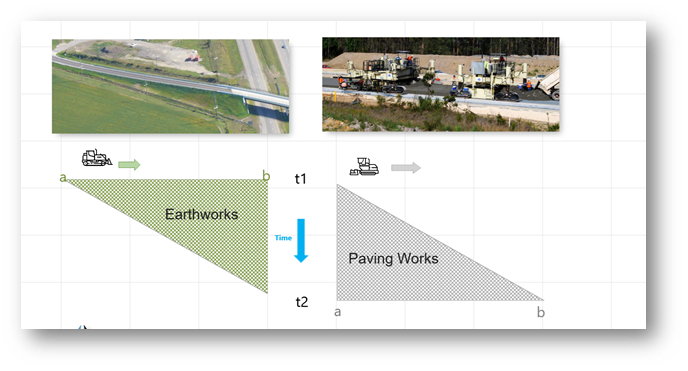
Chart Features: Activity Legend
Time Location charts are enhanced by the use of legends to assist in identifying the works
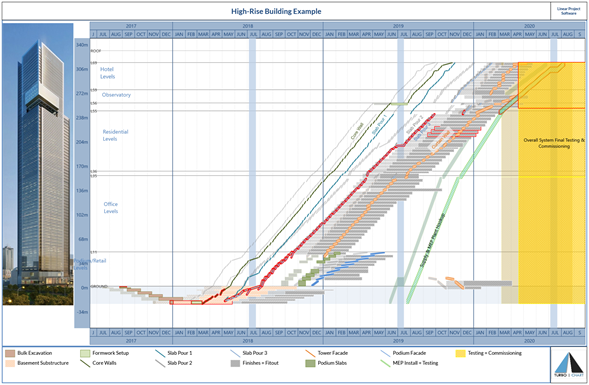
Chart Features: Orientation
It may assist in visualising the project to orientate the axes such that location is vertical and time is horizontal to assist in familiarising to traditional Project Bar or GANTT charts. The example below for a high-rise vertical building shows such an example: